How to Read an EKG Strip in 5 Steps
What is an EKG and What is it Used For?
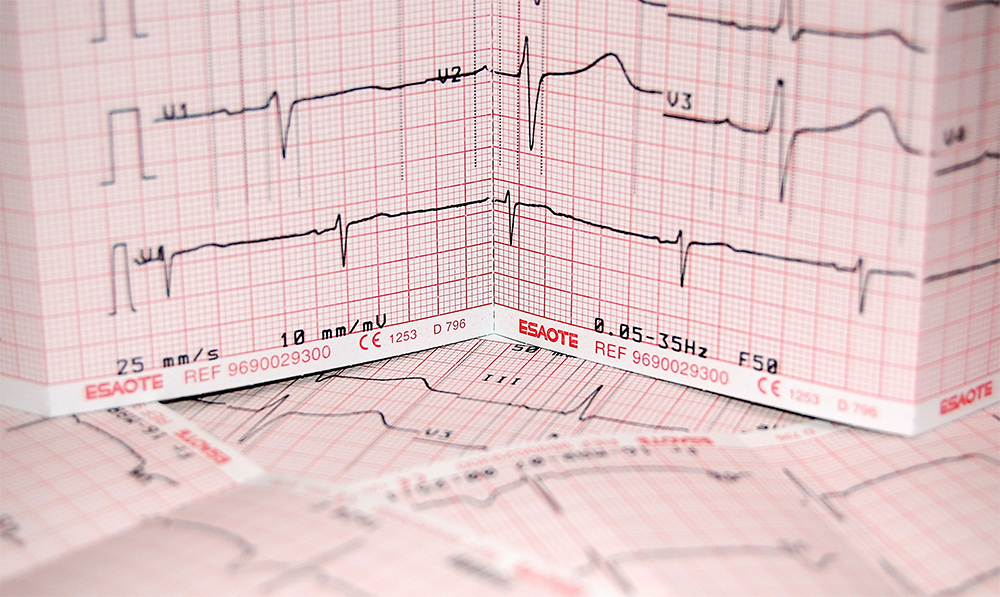
An electrocardiograph (EKG or ECG) records the electrical signals from a heart and captures them on a computer monitor or printer. For instance, Cardiologists often run this test to decide whether a heart is healthy. They are also often used to check for different heart conditions.
Components of an EKG Cycle and What They Tell Us
There are several components of an EKG test that are important for reading a strip. To start, each EKG is made up of large boxes that contain small boxes. Both sets of boxes measure time and distance. A large box, commonly referred to as a ‘big box’ (5mm), represents 0.20 seconds. On the other hand, a small box (1mm) represents 0.04 seconds.
A 12-lead ECG records a 10 second rhythm strip. On this strip, the heart’s activity is translated into line tracings. The dips and spikes in an EKG cycle are called waves that represent different phases of the heart’s activity. To read an EKG, it’s important to understand the components of the wave.
P-Wave
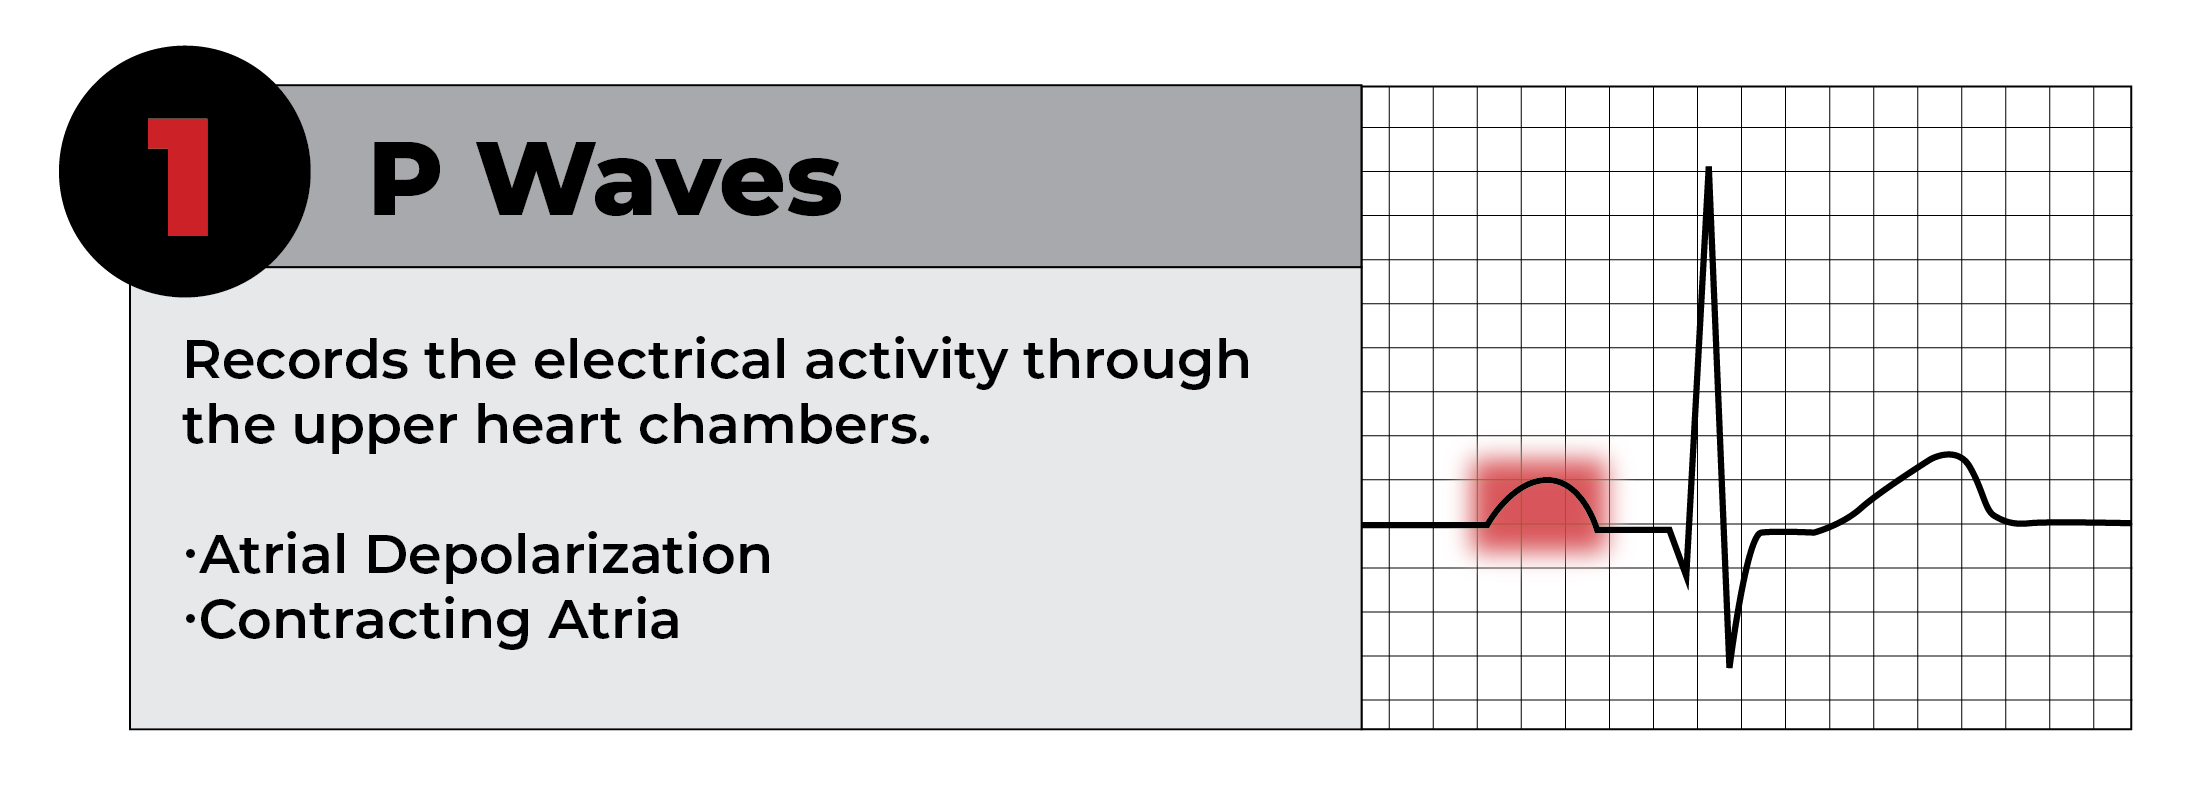
The P-Wave records the electrical activity through the upper heart chambers. It represents atrial depolarization, or contraction.
PR Interval
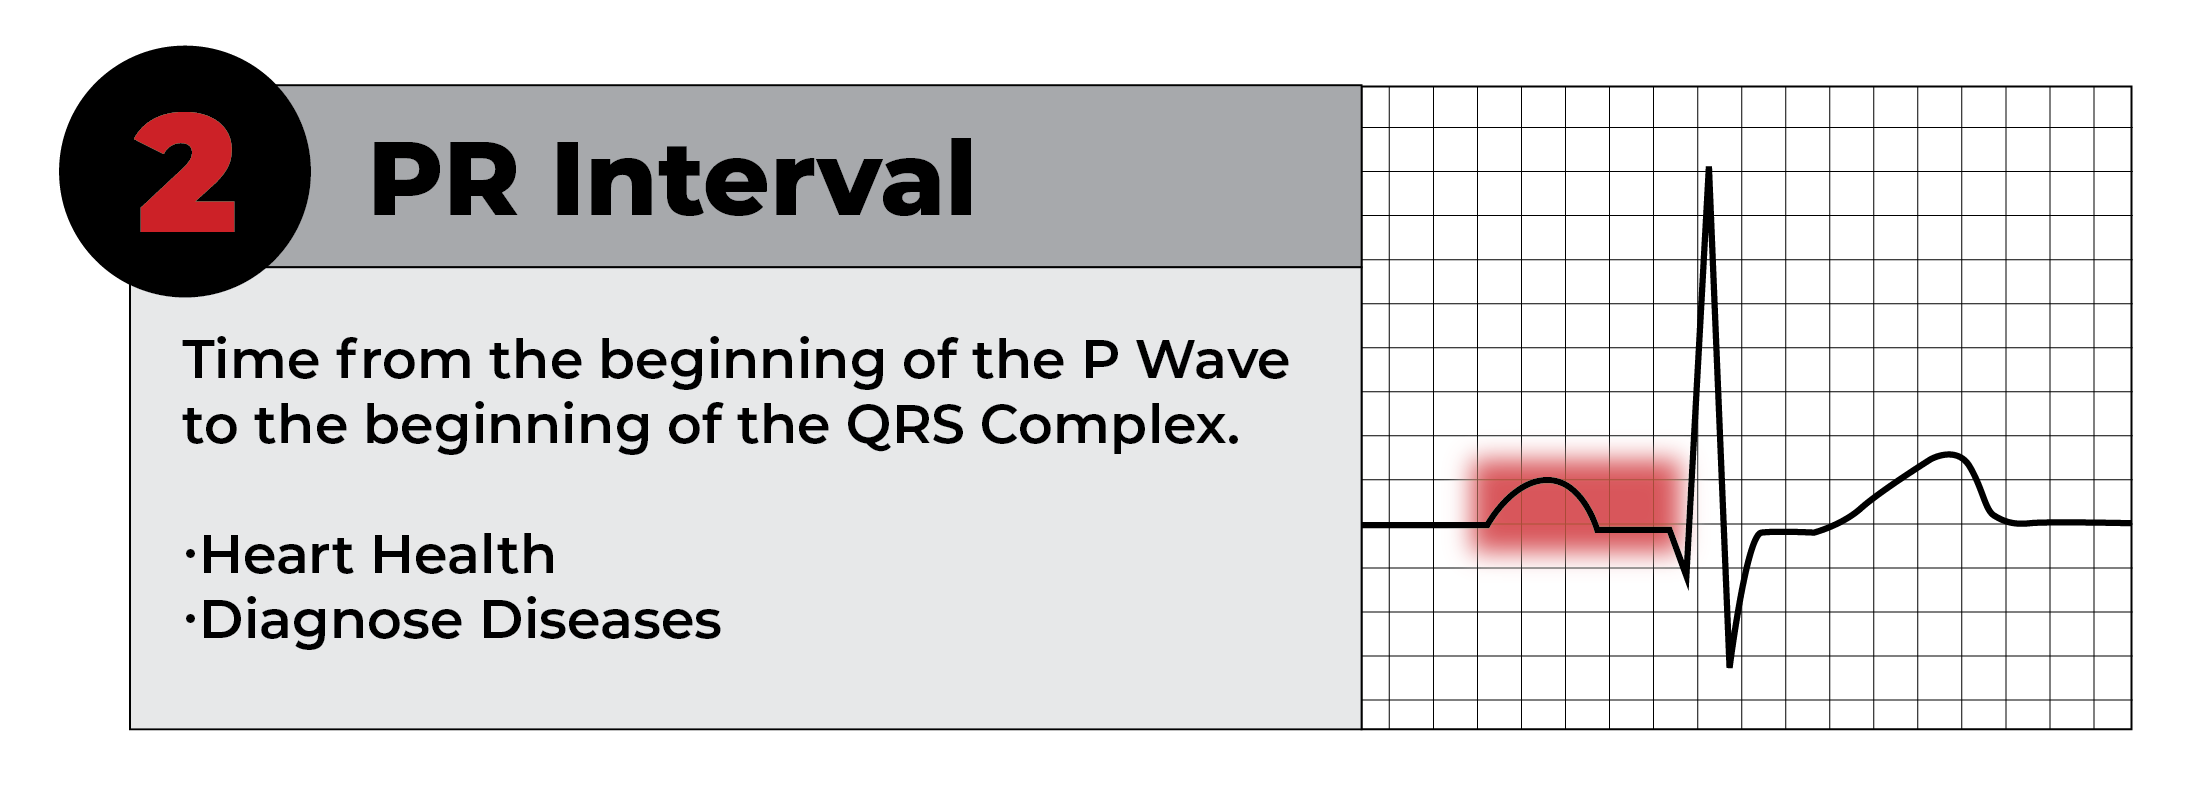
The PR interval spans from the beginning of atrial depolarization (P-Wave to the beginning of ventricular depolarization (QRS Complex).
The duration period of this interval can determine heart health and help diagnose diseases.
QRS Complex
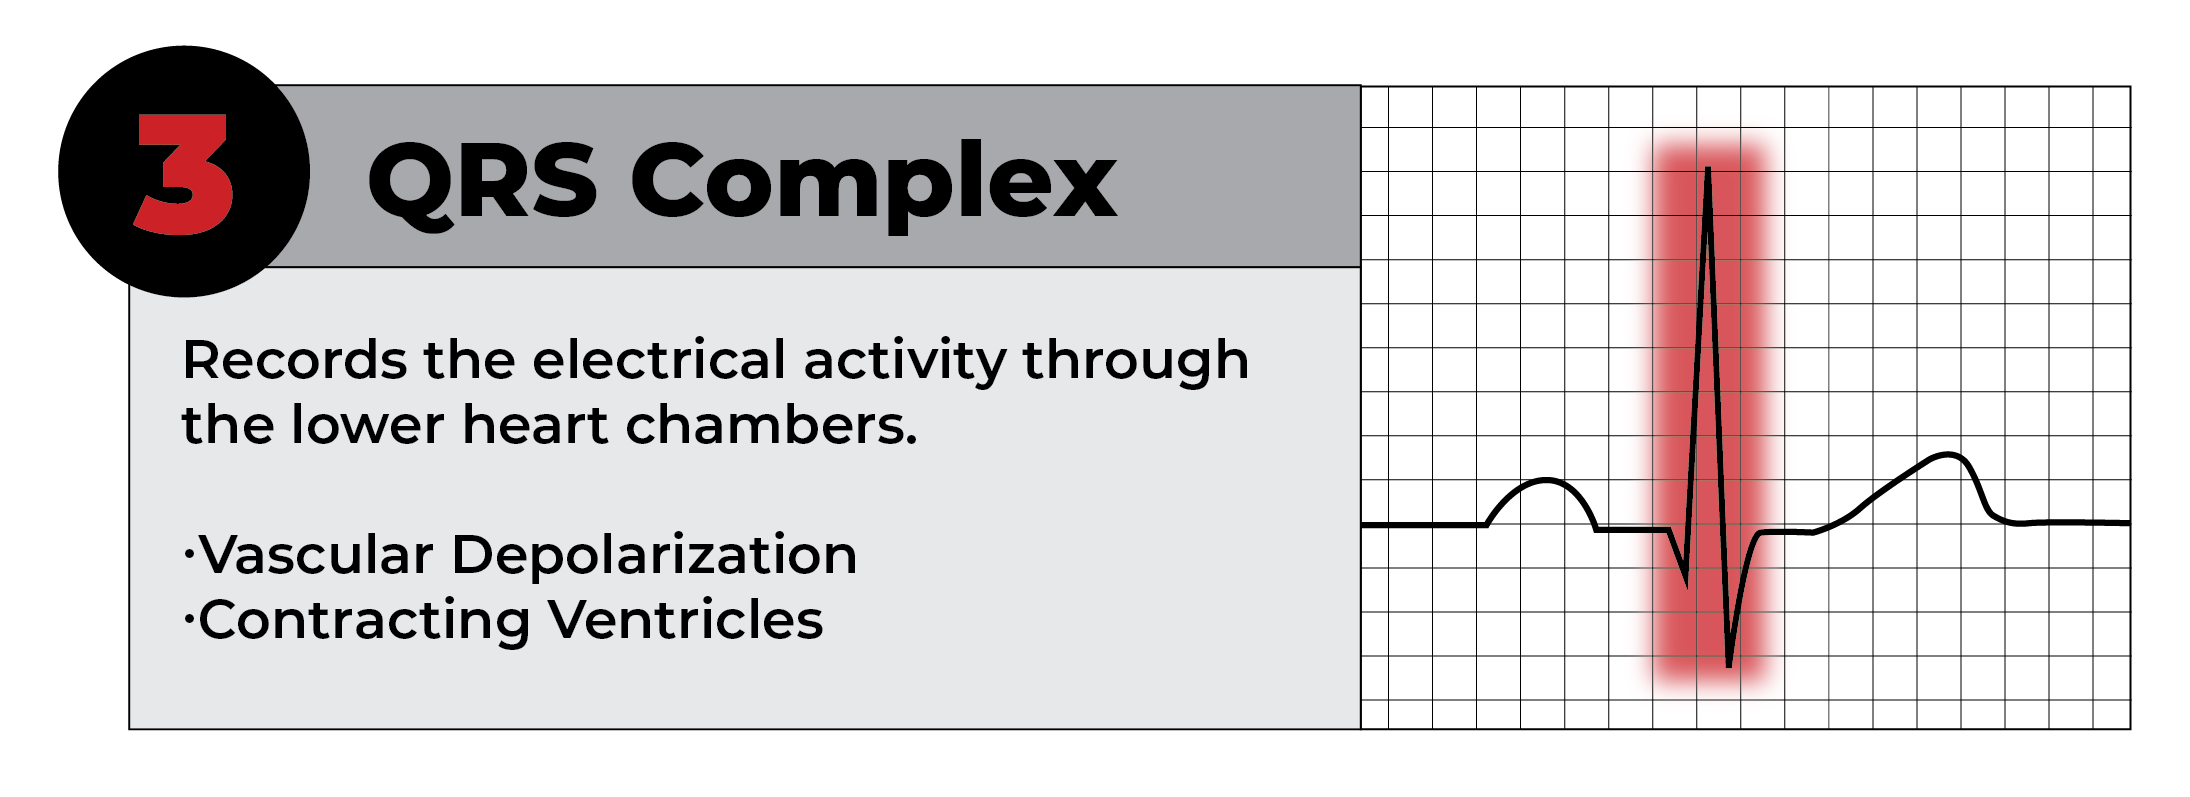
The QRS complex records the electrical activity through the lower heart chambers. It represents ventricular depolarization, or contraction. It consists of…
Q Wave: first downstroke
R Wave: first upward deflection
S Wave: first downward deflection
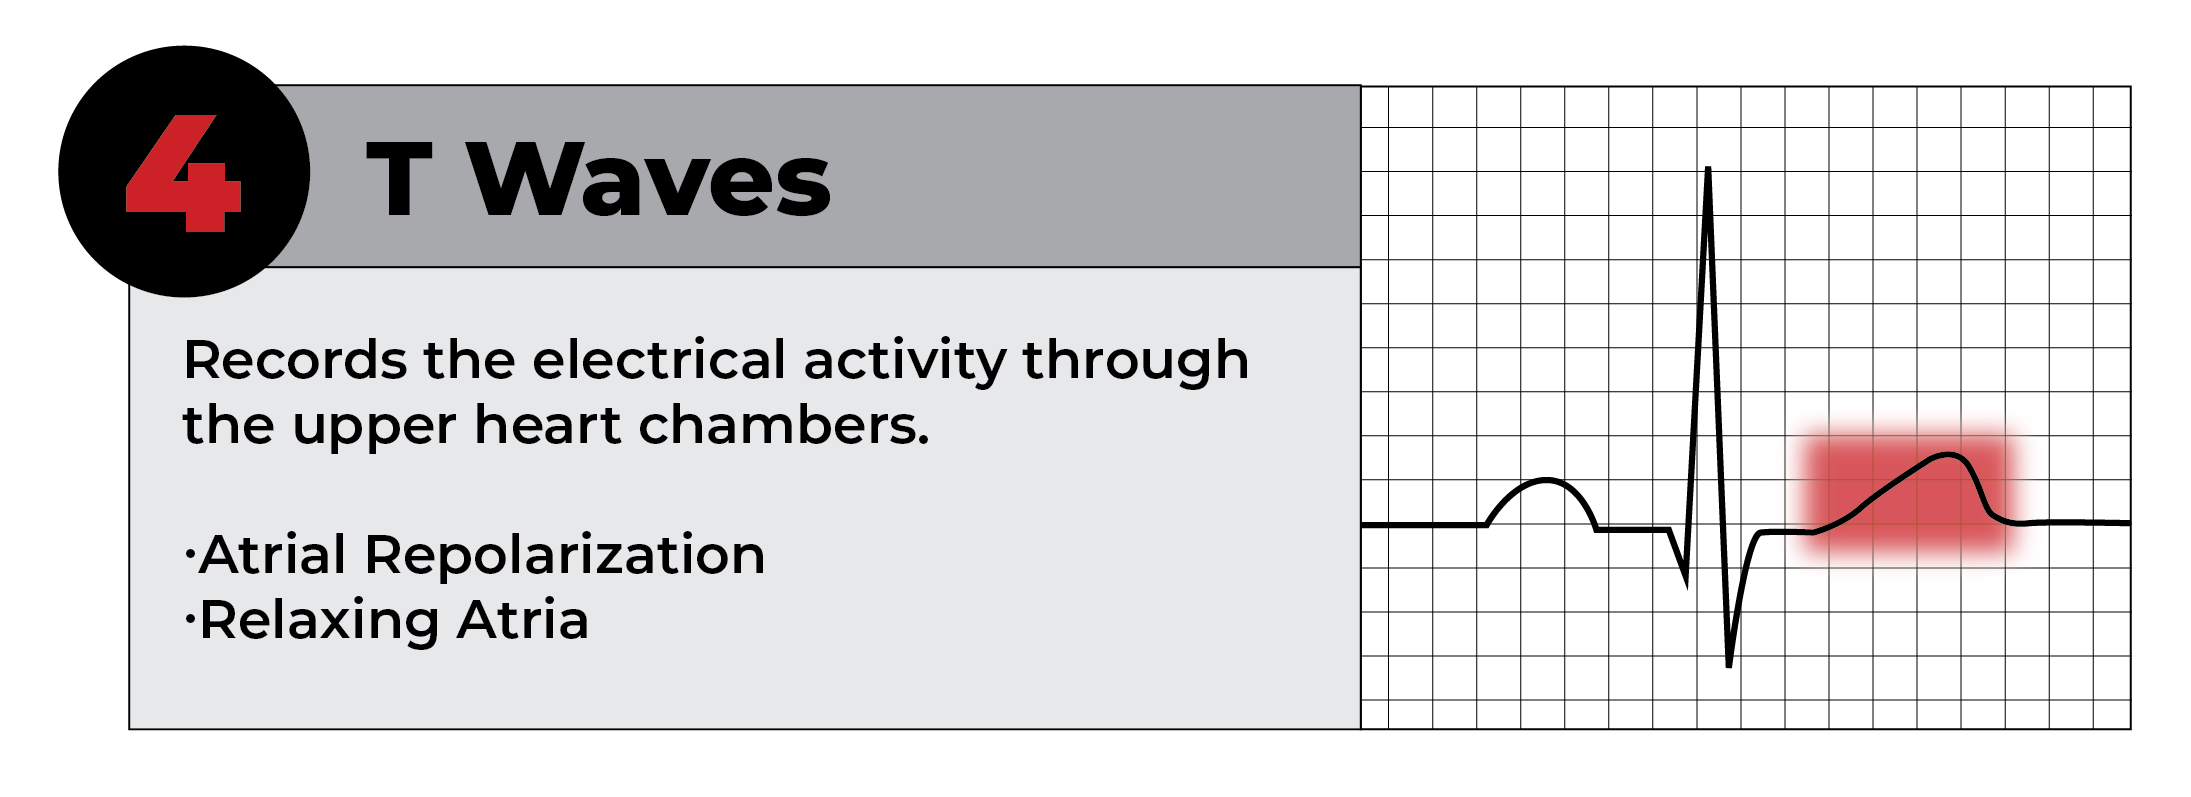
T-Wave
Like the P-Wave, the T-Wave records upper heart chamber activity. However, it represents atrial repolarization, or relaxation.
5 Step Method to Reading An EKG Strip

This method is primarily for reading Non-Interpretive EKG Machines.
The P-Wave, located at the beginning of the ECG cycle, should be present and upright. A P-Wave that is absent or inverted is abnormal.
The P-wave should also not be more than 1 large box tall and 1 large box wide. Normal duration is typically between 0.06 – 0.12 seconds.
The next step is to measure the PR interval. To do this, count the number of small boxes in between the beginning of the P-Wave and the peak of the QRS complex. Then, multiply that number by 0.04 seconds.
Normal interval length should be between 0.12 – 0.20 seconds.
To measure the QRS complex, count the number of small boxes from the beginning to the end of the QRS complex, then divide by 0.04 seconds.
Our normal target range is 0.06 – 0.12 seconds.
There are 3 main categories of rhythms, which are…
Regular: Constant R to R interval
Regularly Irregular: Variable R to R interval w/ a pattern
Irregularly Irregular: Variable R to R interval w/ no pattern
To identify the rhythm, measure the distance between the R waves. Determine if they are consistent throughout the strip.
If the distances are consistent, then the rhythm is regular. If not, the rhythm is irregular.
There are many methods to determine the heart rate using an EKG/ECG. Note that the normal range, at rest, is between 60 BPM and 100 BPM per minute.
Depending on whether the rhythm is regular or irregular, there are various methods that are widely used to accurately measure heart rate.
The Big Box Method
If the heart rhythm is regular, you can use the Big Box Method. To do this, divide 300 by the number of large boxes in between the R waves.
For example, if there are 5 large boxes in between a set of R’s, the heart rate would be 60 BPM.
The 6 Second Method
If the heart rhythm is irregular and you’re working with a 6-second strip, the 6 second method is an easy and viable option.
First, start by counting the # of R waves from beginning to the end of the 6 second strip. Once you’ve finished counting, multiply by that number by 10.
For example, if you counted 6 R’s, the heart rate would be 60 BPM.
The Square Counting Method
This method uses the sequence 300-150-100-75-60-50-43-37. Thus, the first thick line is 300, the next is 150, and so on.
First, count from the first QRS complex and stop the sequence at the next QRS complex. Then, when 2nd QRS complex is in between 2 thick lines. Lastly, take the mean of those 2 lines.
For example, if the 2nd QRS complex lands between 75 and 60, the heart rate would be 67 BPM.


