How to Read a Patient Monitor
Reading a Patient Monitor
Patient Monitors can be slightly intimidating when you’re unsure what exactly you’re looking at. With all of the colored numbers and wavy lines, things can get a bit confusing. Our “How To Read a Patient Monitor” article is here to help, covering the basic standard parameters of a patient monitor.
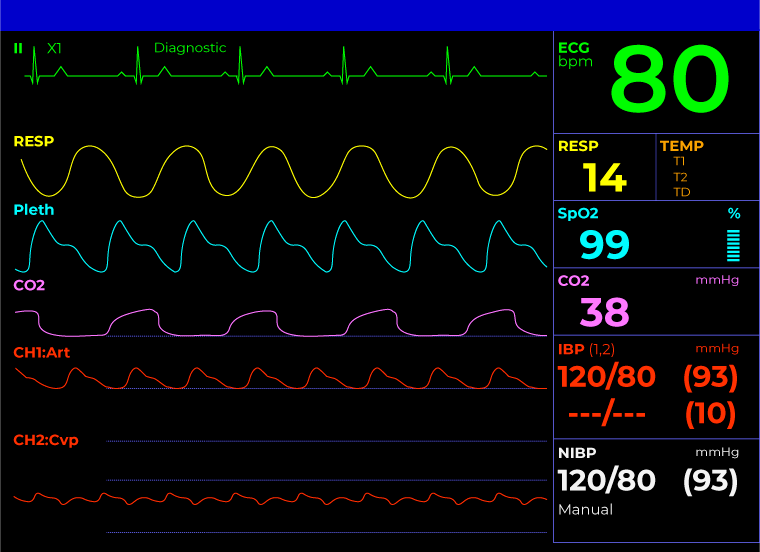
The common layout of a hospital monitor is split, listing the numerical vital signs on the right and the waveforms on the left of the monitor screen. This configuration gives the clinician a general overview of the patient’s real-time vitals. Below is an example of a patient monitor screen.
The Numbers
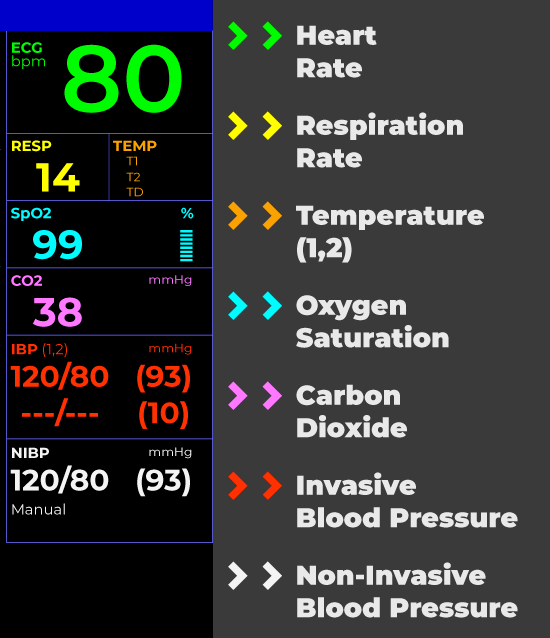
Heart Rate: Also known as HR, the heart rate is typically on display using green numbers, typically located in right corner of the screen. In addition, the number is shown in beats per minute, or BPM.
Respiration Rate: Respiration rate reports in breaths per minute, and displayed as screen as “RESP”.
Temperature: TEMP is displayed on the monitor in either Fahrenheit or Celsius, shown under “TEMP” on the screen.
Oxygen Saturation: Oxygen Saturation, also known as SpO2, is the measures the amount of oxygen in the patients blood.
Carbon Dioxide: Or CO2, reports in mmHg. It is the number on the monitor displaying under “CO2”.
Invasive Blood Pressure: Also known as IBP, reports in mmHg. Further, it’s important to note that some patient monitors can display multiple channels. In this case, Arterial Blood Pressure (ART) and Central Venous Blood Pressure (CVP) is showing. Additionally, Invasive blood pressure is the number on the monitor under “IBP”.
Non-Invasive Blood Pressure: Otherwise known as NIBP, reports in mmHg. Additionally, it is the number showing on the monitor under “NIBP”.
The Lines
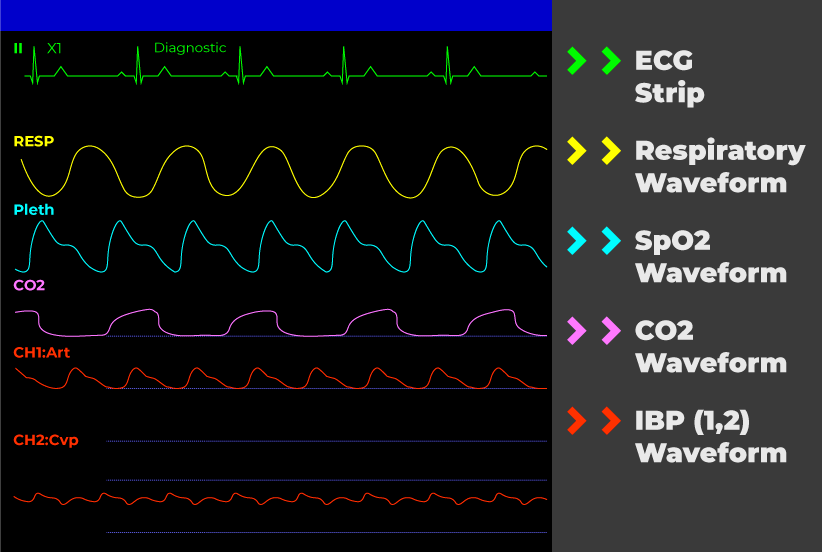
ECG Strip: The intent of the ECG Strip is NOT for an in-depth ECG analysis. Typically, the ECG strip only represents one lead (commonly lead II).
Respiratory Waveform: The Respiratory Waveform can be helpful for clinicians monitoring any respiratory issues like apnea or dyspnea.
SpO2 Waveform: The SpO2 Waveform can help in determining if there are any issues with circulation or peripheral perfusion. In addition, every peak on the SpO2 Waveform should correlate with the heartbeat on the ECG Waveform at close intervals. Further, because oxygenated blood is pumping out of the heart with every single heartbeat.
CO2 Waveform: The CO2 Waveform helps with visualizing how much CO2 a patient is exhaling. Further, normal CO2 Waveforms are generally the shape of a round rectangle.
IBP (1,2) Waveform: The IBP Waveform helps visualize the invasive blood pressure. Some patient monitors will show multiple waveforms. For example, in our case ART (Arterial Blood Pressure) and CVP (Central Venous Blood Pressure) is on display.


